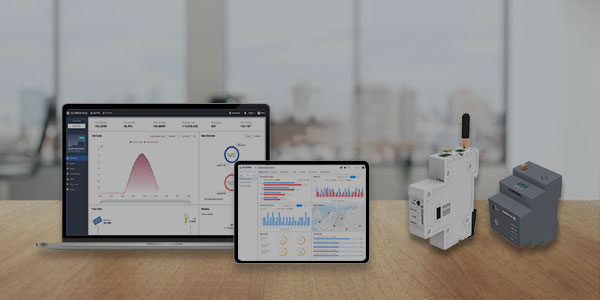
In addition to rich data, SOLARMAN cloud platform also made an intuitive and comprehensive display on the overall operation of the plant, which is the full-screen display function of SOLARMAN cloud platform.
Go to “Applications”-“Display”. Users can check total plant quantity, installed capacity, production power, daily production, yearly production and etc,.
From left to right, users can view multiple sectors, e.g. CO2 reduced, plant distribution, monthly production, yearly production,work order, peak hour ranking and etc,.
Low carbon society is what we are looking for. The CO2 reduced figure is a very meaningful hint of energy conservation. Users can introduce PV plant to the friends and say, “Hey, since I installed a PV plant, I reduced CO2 emissions of the world every year.” This will be a very proud and beneficial behavior.


